As promised in the live chat, i asked for the colour codes. Turns out, not as simple as one would think.
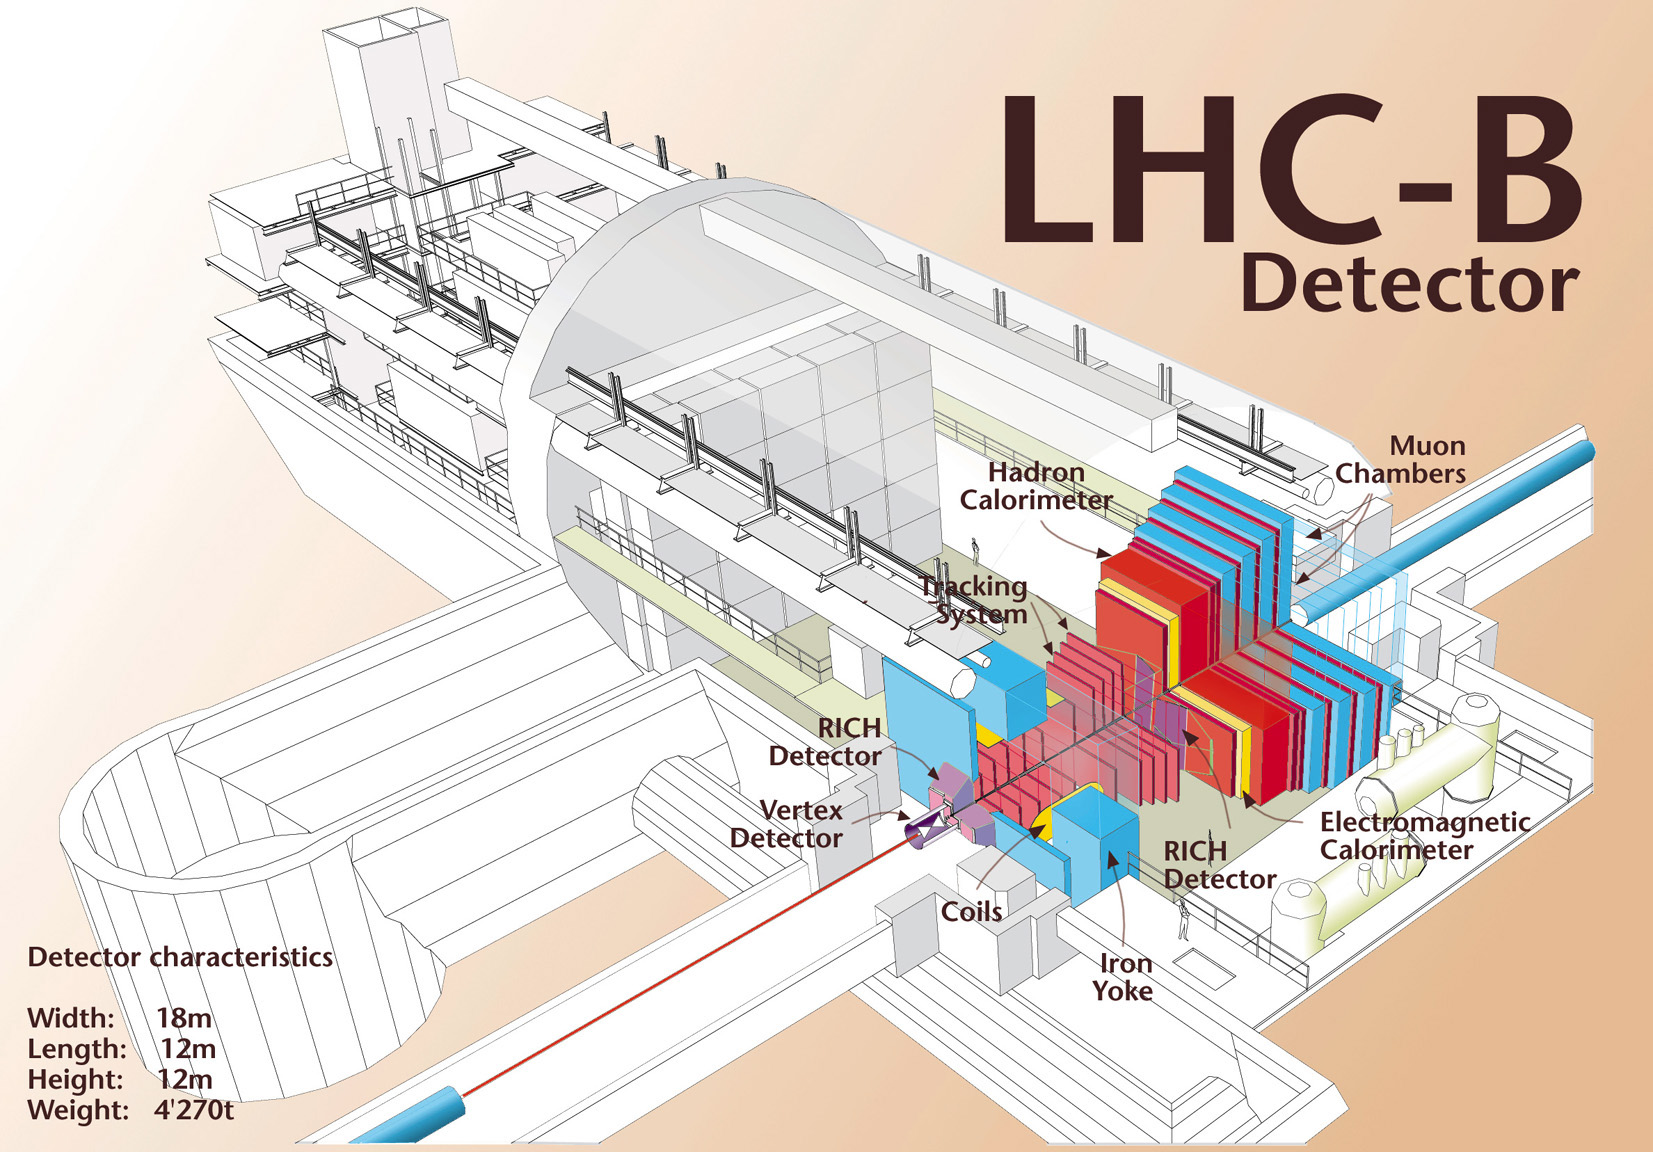
So i hope i understood this correctly. The program that produces this Plots is called Panoramix. This package visualises all objects, that can be generated by other LHCb software packages. So what you see in the event displays is the detector looking down from the ceiling (you probably figured that out already

).
So the first things, that are drawn, are the detector volumes. This is the beam pipe, the magnet and the rectangular boxes for the ECal, HCal, M2-M5 and TT. (Note that the OT, Velo etc. is not drawn). The next thing are the measurements by the detectors. The calorimeter measurements are easy to see (red and blue bars). For are tracker measurement the detector element which performed the measurement is drawn. In the case of the OT, this would be a 2,5m long straw. However, as the straws of the OT are pointing into the plane of the picture, you only see a grey pixel. (If the whole OT is illuminated, you get grey vertical lines.) The RICH measurements are the orange circles, the Muon measurements are the green blobs.
The result of track reconstruction is shown on top of that. The first step is a local reconstruction in the VeLo.
If the track is going in the wrong direction it is shown in green yellow (VeLo back). If it is going in the right direction, it gets green (VeLo). For these tracks the software tries to add hits in the TT. If this is successful, it gets the colour cyan (VeLo-TT or upstream). The Velo and Velo-TT track are extrapolated to the middle of the magnet. This object acts as a seed for the track finding algorithm. This means that the software defines a search window from the middle of the magnet, in which it looks for hits in the OT and IT. If this is succesful, the whole object gets the colour blue (long).
Now you can do this from the other side too. You can do a local reconstruction from the measurements in the muon stations. The result is a muon seed. These are the green lines running all across the event display. You extrapolate this line to the ?? (middle of RICH2, M1 ??) from where you again start a search window into the IT/OT.
A third seed is the extrapolation of the hits in the calorimeter, which again defines a search window into the IT/OT. If you find a track in the IT/OT from a muon or calo seed, these get again the colour cyan (TTracks).
These objects are again extrapolated into the middle of the magnet. If you find hits in the TT for the tracks, it gets the colour grayish light blue (downstream). If you find VeLo Hits, you are again blue (long).
The hits, that are used to build a track are marked with a X. A green X says, that the track finder is pretty sure that this hit belongs to the track. Yellow means its somewhat sure and red means its not sure at all.
Okay at this stage you have build your tracks. Now you combine this with measurements in the RICH1 and RICH2. If the software thinks the measured photons are caused by a track, it connects the orange circles with the track via a dark purple line.
Whats left over a the purple lines that dominated the first plots. As you have no VeLo seeds at the beginning and very few calo and muon seeds, the OT performs its own local track finding. These tracks are only based on OT measurements. These are not TTracks, as no seed was used.
Wow, pretty long text (at least for me). I hope i did not mess up with the colours
